Help
Webapp Overview
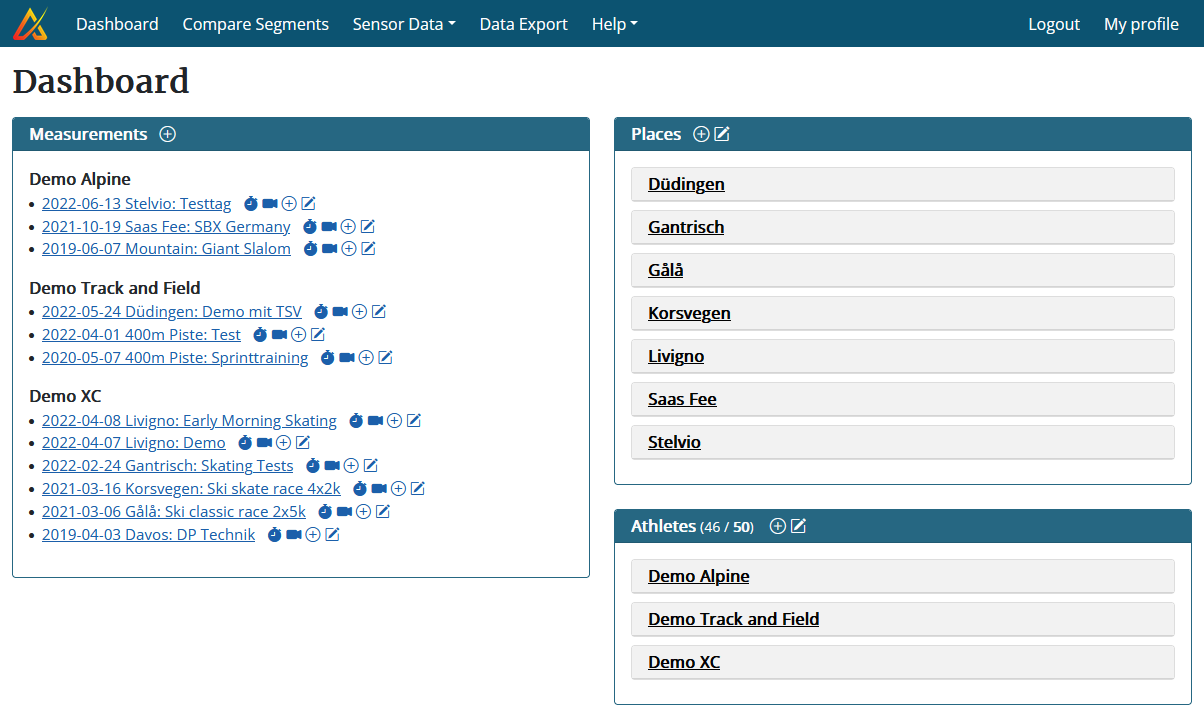
Dashboard
The webapp stores all the recorded data. Each measurement is attributed to a place, athlete, and training session. Individual athlete's data can then be found under the corresponding training session.
Measurement
A measurement is divided into so-called segments. Each segment marks one part of a measurement and tells the webapp that his part is important and should be analyzed in-depth. Performance information is only be provided for these segments. This allows to ignore irrelevant parts, such as warm-up or cool-down.
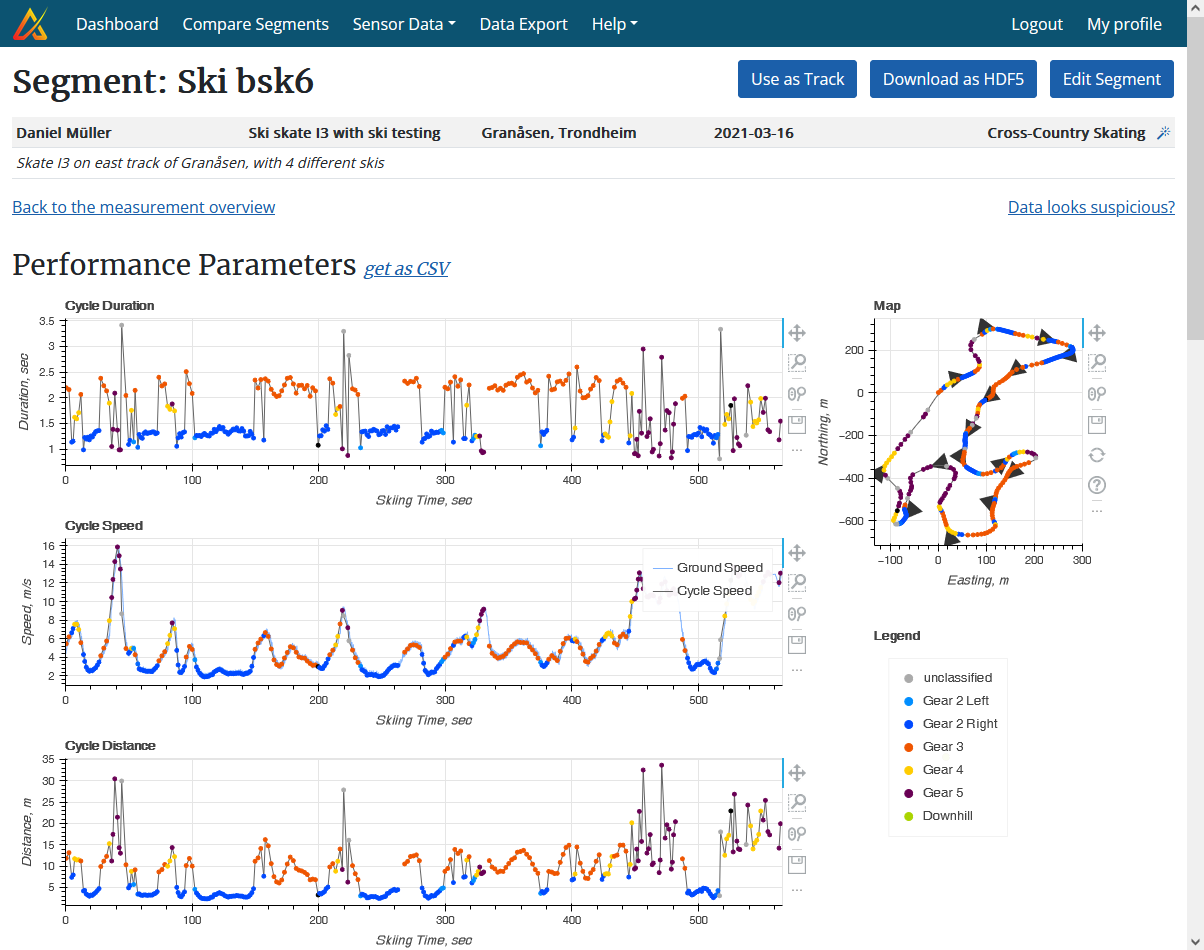
Segment
All the data analysis and feedback is then done with these segments: one can display the performance parameters for each segment individually or compare two (or more) segments. Each sport has its own performance feedback: what is shown for alpine skiing is different from cross-country skiing or athletics, for example.
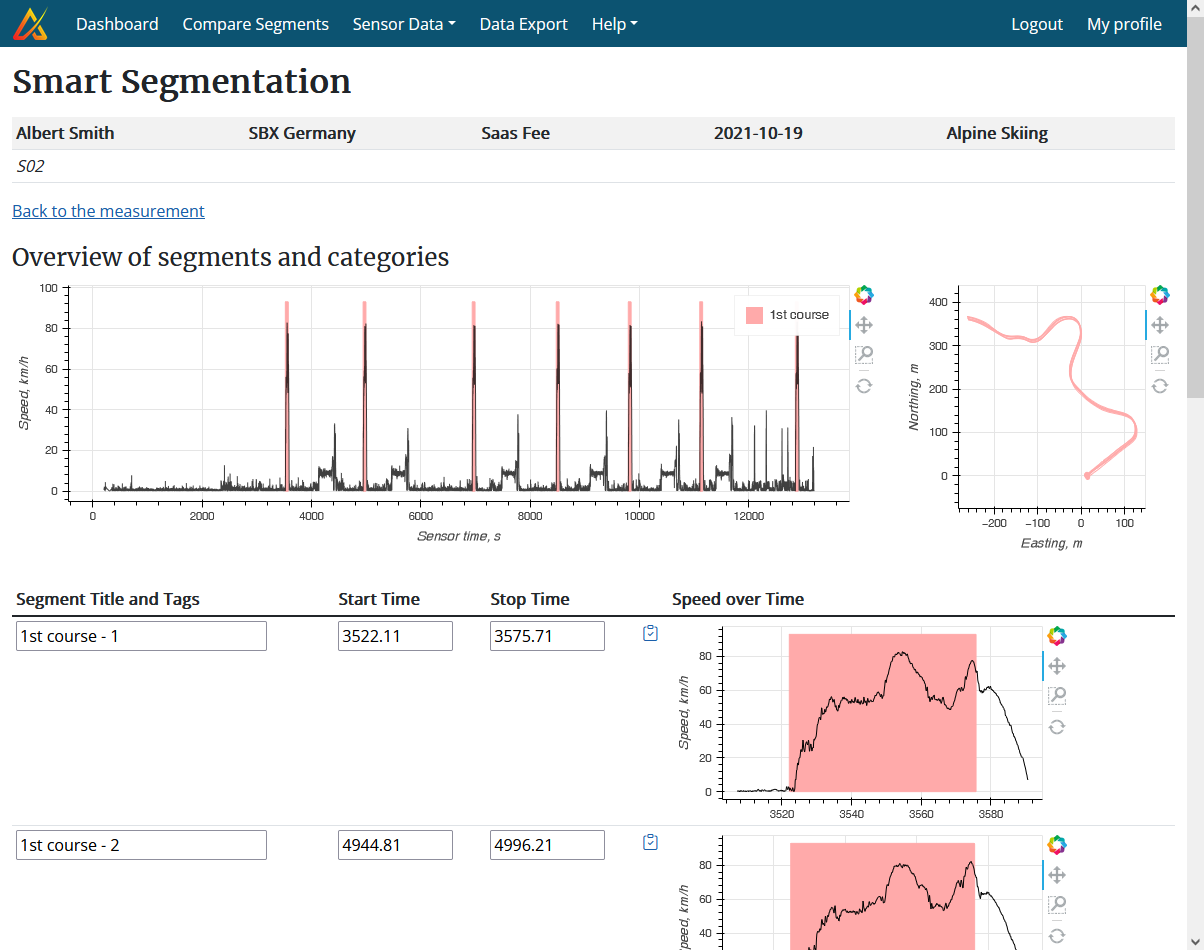
Smart Segmentation
We have implemented smart algorithms which automatically detect all the segments which could be interest. For alpine skiing, for example, all runs are automatically extracted. For cross-country skiing, each lap skied on a particular track. For biathlon, each passage through the shooting range, including the shooting itself. For athletics, each sprint, run, or jump.
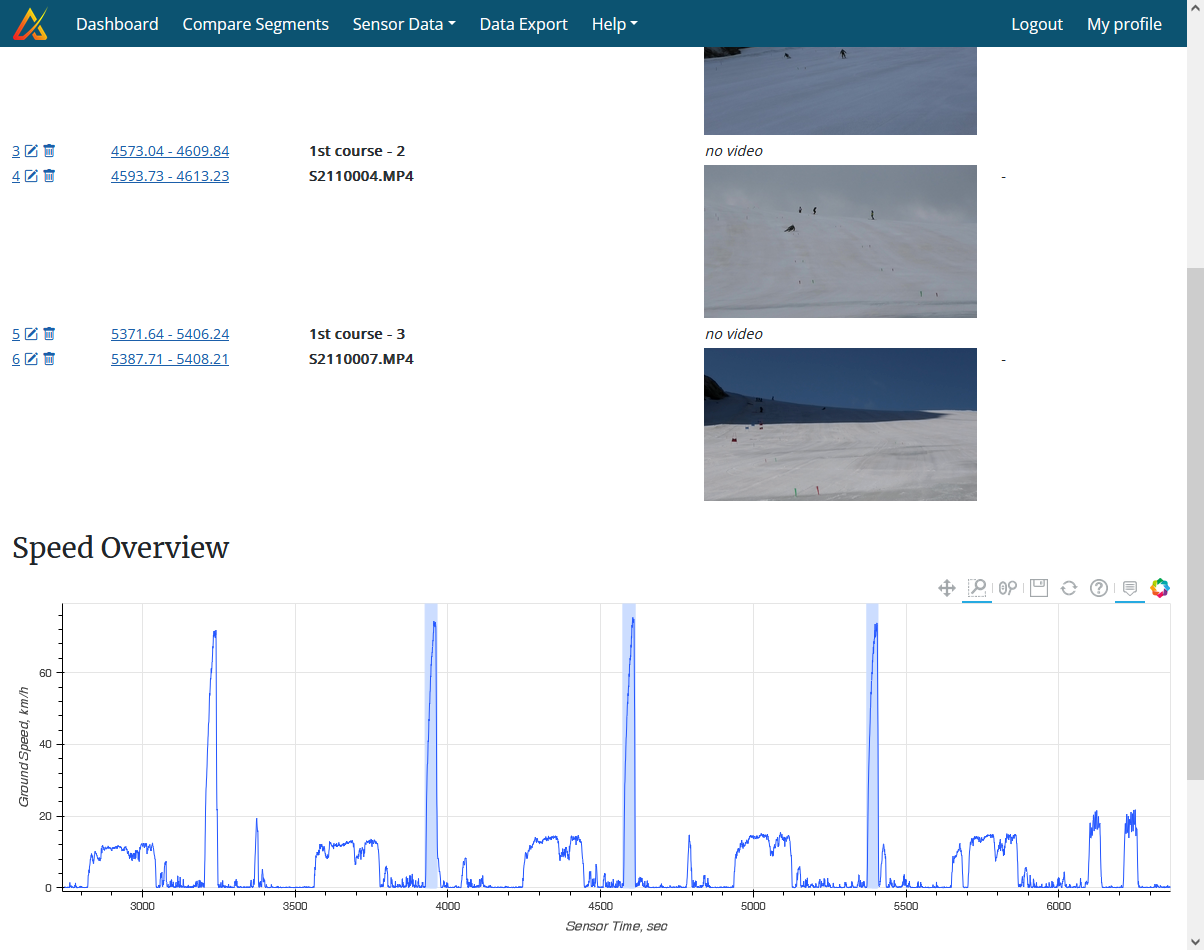
Video Synchronization
Videos are automatically synchronized with the data during video upload. Simply drag and drop the video files onto the corresponding field. For each video a segment will then automatically be created. For certain sports our algorithm is even able to recognize which athlete is in which video. It's so simple we don't even need to show a screenshot or explain more 😉.
Performance Feedback and Segment Comparison
In addition to "single segment feedback" there are numerous ways to compare performance between segments and over time. Some examples are shown here.
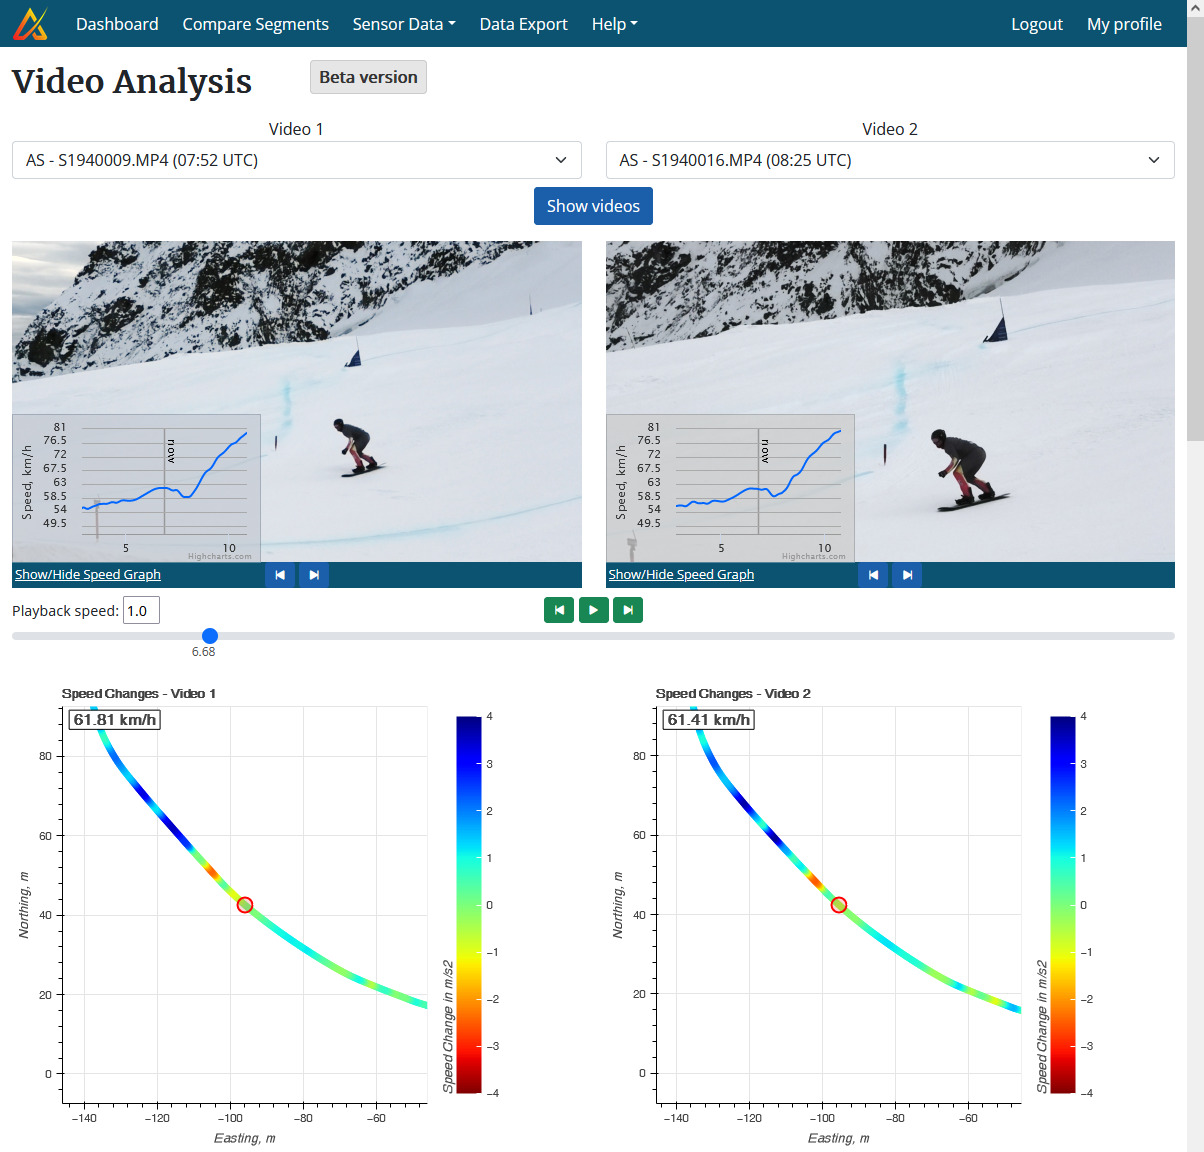
1. Side-by-side video player
Simultaneous playback of two videos side-by-side. The videos are automatically synchronized with respect to the position of the athletes at the start of each video. Playback can be at reduced speed or frame-by-frame. To resynchronize videos, each video can be played forwards or backwards independently of the other video.
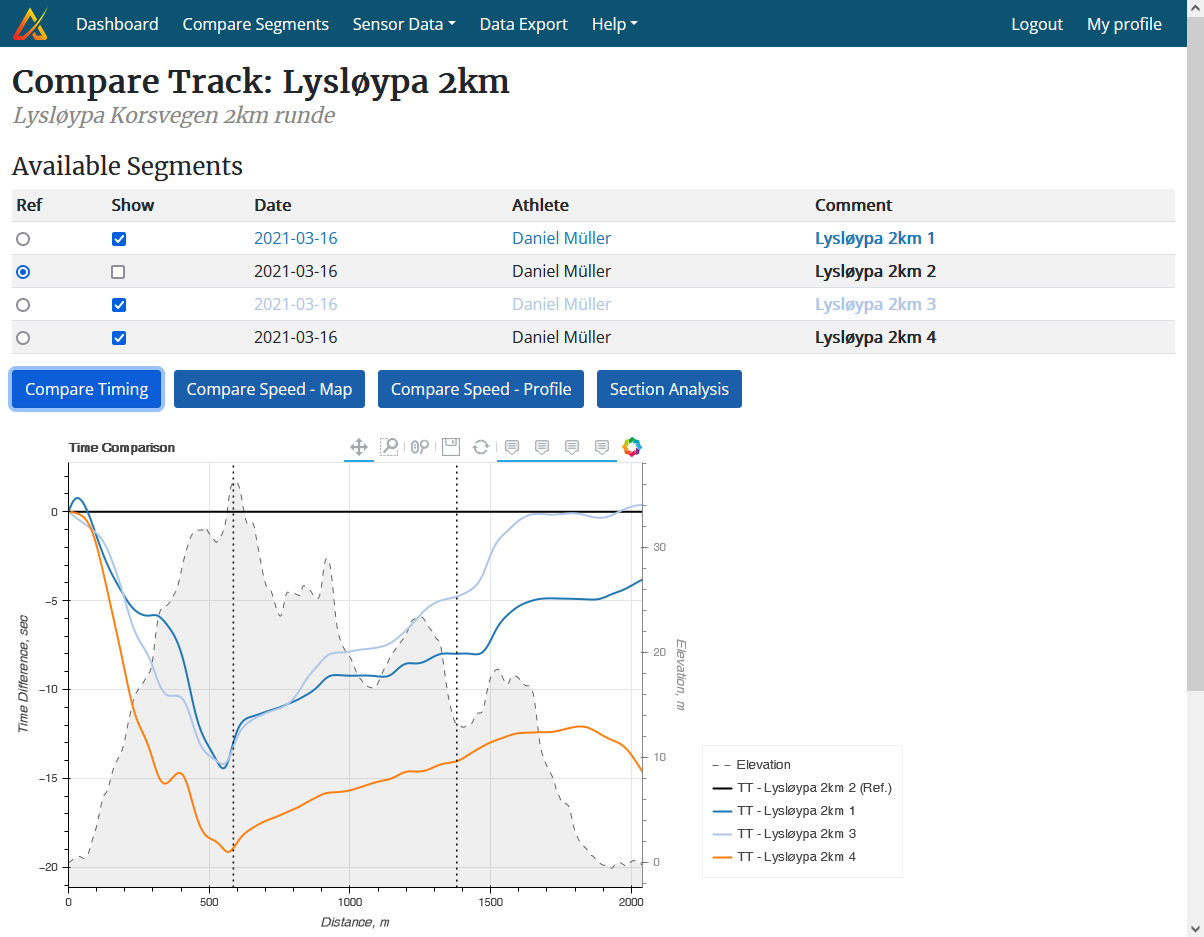
2. Track Comparison
For cross-country skiing, all segments obtained from the same track can be compared. There are different analysis displays possible: continuous split times, speed comparison, section analysis.
The example to the right shows continuous split times for four 2km laps. Lap 2 was selected as reference and its time was set to zero. The other colored curves show the (relative) time difference to this reference lap for each meter.
3a. Race Analysis: Cross-Country Skiing
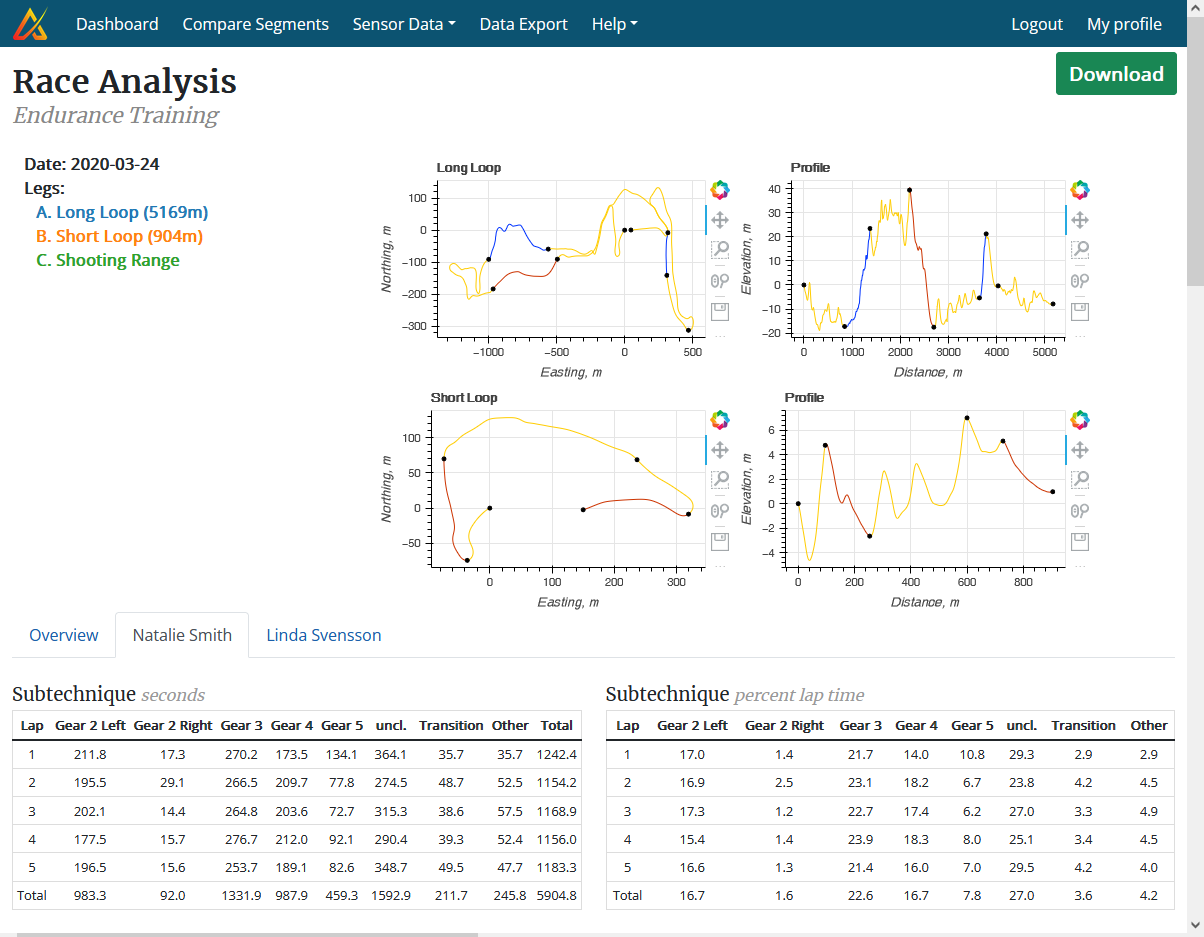
For cross-country skiing and biathlon, a complete race can also be analyzed on a single page, with tabs for athlete-specific details and comparisons. The race analysis provides a general overview, times spent in each section (classified into uphill, downhill, mixed), compares continuous split times, provides sub-technique statistics, and does speed comparisons. For biathlon, all the shooting times will also be shown. The entire page can be exported as an HTML file which can be shared to persons not having access to the webapp.
The example to the right shows a race analysis for two athletes with three different legs: a long loop, followed by a short loop, followed by shooting. The race analysis automatically sorts all the segments and compare the right laps and loops. Shown here are the overview statistics for the sub-techniques of one athlete.
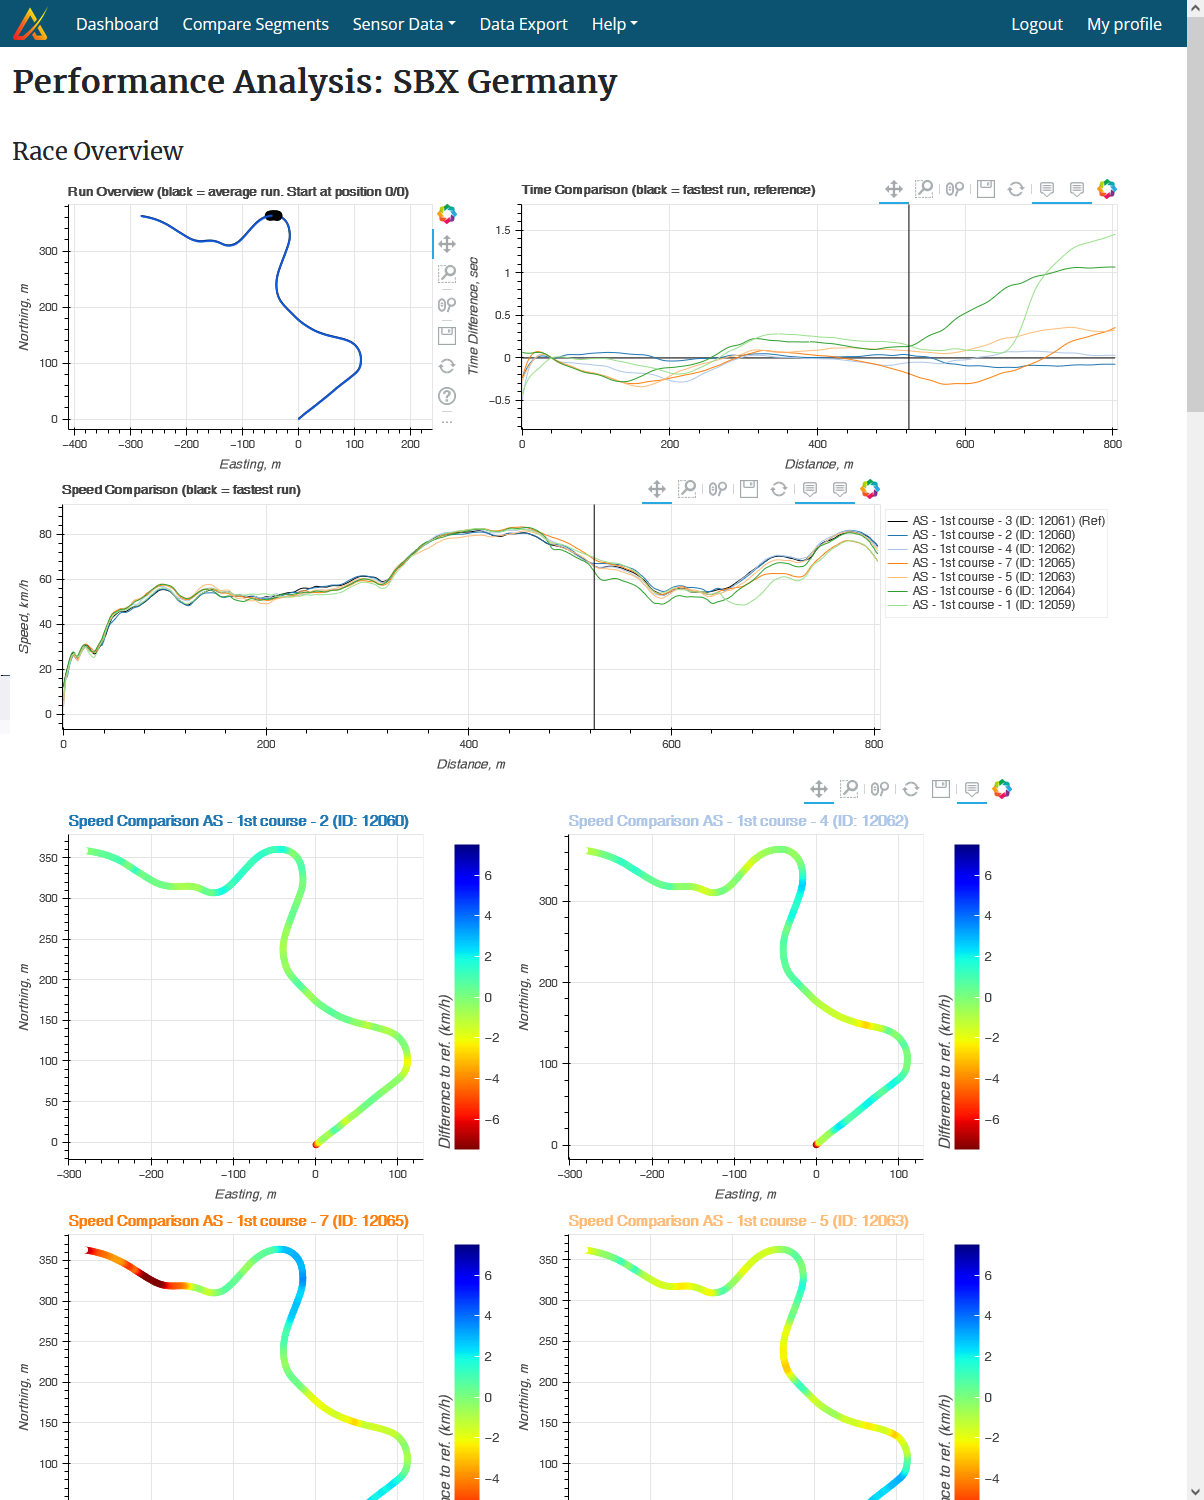
3b. Race Analysis: Alpine Skiing, Snowboard- and Ski-Cross
For alpine skiing, snowboard- and ski-cross (and related disciplines), all runs of a given day can be analyzed and compared. First, split times can be set on a map (after the race) for regular split time and section analysis. Second, all runs can also be compared with continuous split times and speed curves and comparisons.
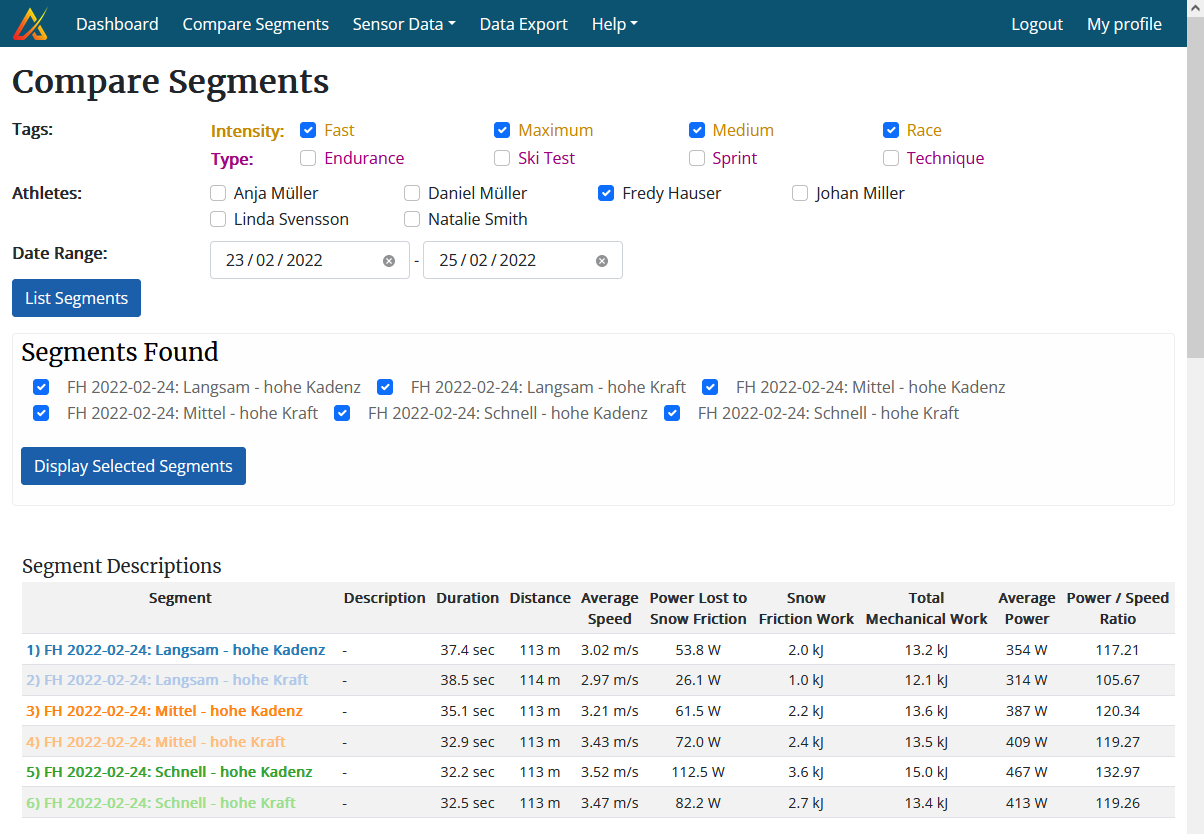
4. Compare Segments
For power and continuous centre of mass speed comparisons, track and field and cross-country skiing segments can be tagged accordingly. They can then be loaded for comparison, according to these tags, athletes, and dates. The continuous centre of mass speed also allows to efficiently compare the influence of different skiing or running techniques on the speed changes.
The example to the right shows the comparison summary. Further down on the page are different plots, showing continuous speed and corresponding cycle parameters.
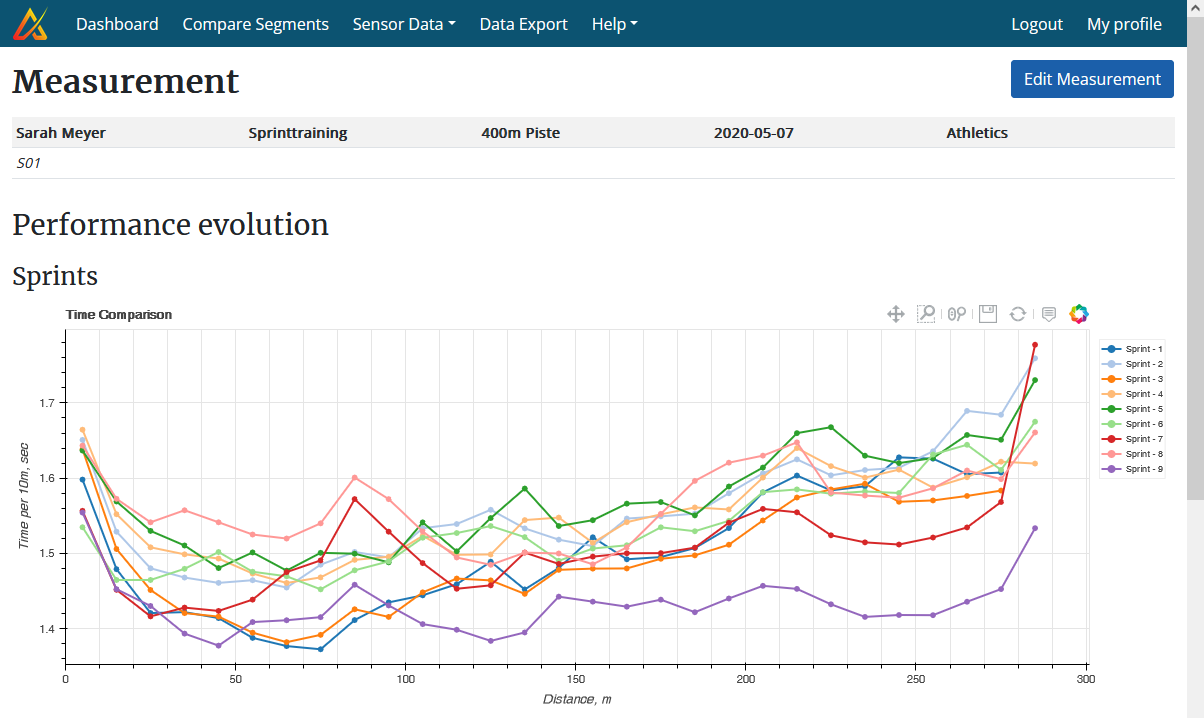
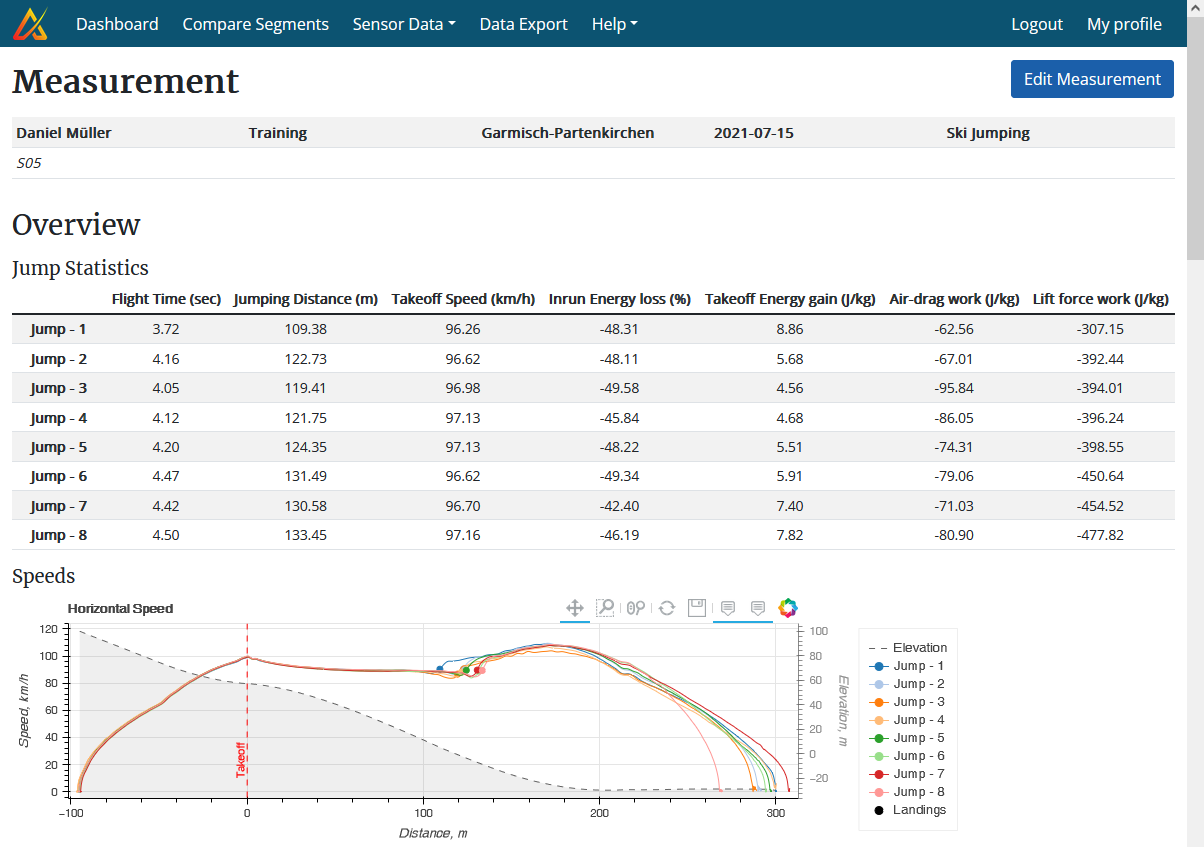
And there are many more comparison possibilities, specific for each sport. Such as 10 m split times for sprint running or jump parameters for ski jumping: